Like all popular social media platforms, Facebook offers detailed analytics via a professional dashboard to help you reflect on the performance of your Facebook posts, pages, and profiles.
Learn how to boost your social media presence with key metrics data from Facebook Insights and increase engagement on your Facebook page today!
Where To Access Facebook Analytics
Facebook pages with at least 30 follows/likes will unlock access to Insights data.
To access your Insights, visit your Facebook page and click Meta Business Suite on the left hand menu.

From here, click Insights.

You can adjust the timeframe using the drop-down menu on the top right.
How Often Do Facebook Insights Update?
Facebook analytics data is updated every 24 hours. This applies to all metrics, though weekly data summaries take 7 days to be generated.
Keep in mind that certain Facebook performance metrics, such as post reach, are estimated and are not 100% accurate even from the professional dashboard.
Certain metrics may offer real time data, such as livestream views, but for the most accurate results it's always best to wait at least 24 hours.
Facebook Insights: Key Metrics To Understand
Overwhelmed by all the metrics available in Facebook analytics? Don't worry - we'll break down the most important ones so you can focus on improving your Facebook content without stressing over complicated graphs and charts.
Follows

This metric indicates how many follows (or page likes) you've received on your page within the given timeframe.
Clicking this section will bring up a detailed page that shows:
-
Your total follower count
-
Age & gender demographic data
-
Top cities demographic data
-
Top countries demographic data
Note that you will need at least 100 page followers to access audience demographics.
The Difference Between Page Likes & Follows
When a user Likes a Facebook page, they automatically Follow it as well. They can then unfollow the page or profile while still Liking it by adjusting the settings in the page submenu.
When a user Follows a Facebook page, they do not automatically Like it.
In other words, a Like results in both a Like and a Follow, but a Follow only results in a Follow.
Reach

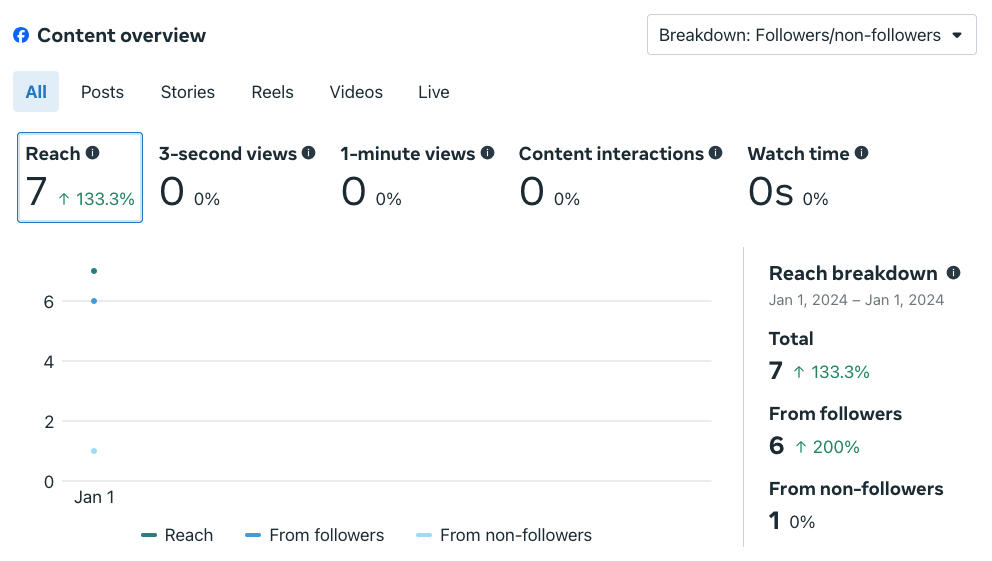
Reach represents the average amount of unique users who viewed content from your page. Unlike impressions, reach will not increase when the same person views a piece of content multiple times.
Note that Facebook Reach is an estimated metric, which means it may not be 100% accurate. This is also not real time data, and can take up to 24 hours to update.
This metric is split into reach from followers and reach from non-followers.
Clicking the Reach overview tab will bring up a page that includes your total Reach for the given date range, plus a breakdown of Reach from ads (paid distribution) vs organic posts OR from followers vs non-followers (which you can toggle between using the drop down menu on the top right).

You can also navigate between tabs to view Reach data from each post type including:
-
Posts
-
Stories
-
Reels
-
Videos
-
Live
Interactions

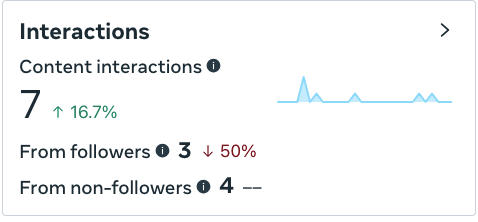
The interactions tab will show you the amount of engagement your Facebook content has received within the given time frame. This tab includes total interactions as well as a breakdown between followers vs non-followers.
Interactions or engagement metrics include:
-
likes or reactions
-
saves
-
comments
-
shares
-
replies
This data applies to all content on your page including:
-
posts
-
stories
-
reels
-
videos
-
livestreams
Clicking the Interactions tab will take you to the overview page for the given timeframe. You can view interaction overviews for different content types by navigating between tabs at the top.

Interactions insights data is a great way to see how many people interact with your content, which content receives the most engagement, and any engagement trends for the given timeframe.
This can help you set goals and ensure that your content resonates with current and new followers.
Page Visits

Also known as Page Views, page visits data can be access by clicking the Results tab on the left hand menu.

In short, this is the number of people who visited or viewed your page within the given timeframe. While this data is updated every 24 hours, note that for a new page it may take a bit longer to gather data
Content Analytics
Clicking the Content tab will bring up all posts within the given timeframe. From here you will be able to see where the post was published (Facebook or Instagram), the type of post (Photo, Video, etc), as well as the date and time it was published.

On the right, you will see a summary of:
-
Reach
-
Likes and reactions
-
Comments
-
Shares
Clicking a specific post will provide you with an Overview that includes data on:
-
Reach
-
Impressions
-
Interactions
-
Link clicks

You will also see a feed preview and a post reach graph.
Beneath this is an Impressions break down based on where the impressions were obtained (from the original post or via shares).

At the bottom of the page you can find the Interactions section, which includes the total number of interactions vs the interaction type including:
-
reactions
-
comments
-
shares
-
saves

Depending on your content type you may also be able to review:
-
Facebook watch time
-
view count
How To Export Facebook Analytics Data
You can export Insights data via the following areas within the Meta Business Suite:
- The Content page (at the top right)
- The Results page (on the top right corner for each analytics type)
- The Audience page (on the top right corner)
To export your data, click the Export drop down menu and select the file type. This will automatically download your data, which you should be able to access in your browser's Downloads pop up window.
Frequently Asked Questions
How accurate is Facebook analytics real time data?
Facebook insights data is 100% accurate with the exception of Reach and Audience Insights, which are estimated.
Why can't I see Insights on my Facebook page?
If you've made a new page, you'll have to accrue at least 30 Facebook followers /likes before you can unlock the professional dashboard. You'll need to have at least 100 followers before you can access Audience insights including demographic data on top cities, top countries, and more.


